
WHAT EXACTLY IS A/B TESTING?
Suppose, you want to make some changes to the app homepage hoping to increase the booking conversation rate(users who make a booking/users who land on our homepage). Let’s say that the conversion rate(CR) for our existing page(A) is 10%.
You think the conversion could be better if we made some changes to the homepage and you come up with a new homepage(B). Before rolling out the changes to the entire user base, you would like to conduct an experiment sending small traffic to the new homepage and remaining to the existing page.
From this experiment, you want to conclude if there is a meaningful bump in CR and if there is, you will make the changes for all the users.
SETTING UP AN A/B EXPERIMENT
Split the traffic into control(A) and test(B) groups. You might want to start by sending a small population(~10%) to the test group to ensure that there is no major impact on the business as a result of the sudden change.
Decide the minimum effect that you want to detect between the test and the control group.
Calculate the duration for which you will need to run the test.
The first step is pretty simple! Coming to the next step -
What does the minimum effect mean?
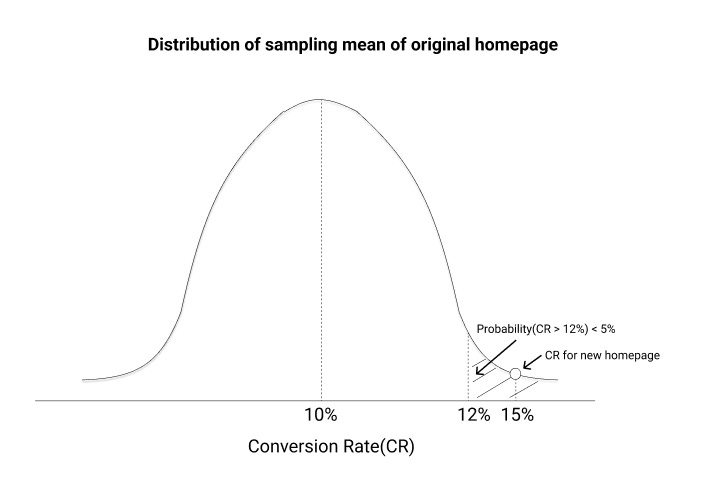
Suppose the conversion rate for the original homepage is 10%. From the new homepage, you want to conclude if the conversion exceeds the old page CR by at least 2%. If the change is less than 2%, you are better off with the existing homepage.
You start the experiment and you see that the CR for the new homepage is 15%. Can you conclude that the new homepage is better than the base version? Not so fast!
You need to be sure that what you are seeing is not an outcome by chance. How can you be sure? For that, you will need to define 2 additional parameters - significance level and power for your test.
LET’S GET INTO THE MATHEMATICS
For our original homepage, the CR is 10%. If we take multiple samples of users going through this page, then the distribution of the CR of all the samples will form a normal distribution and the mean of the distribution will be the same as the population(the entire user base) mean, which is 10% in our case.
For our test, we have a null hypothesis - CR is less than or equal to 10% which means that nothing has improved even after the changes, and an alternate hypothesis - CR is greater than 10%.
Going back to the CR for our new page which came out to be 15%, we need to ask what is the probability that the CR will be 15% or more for a sample of users on our original homepage.
If the probability is more than a threshold (say 5%), we might say that the 15% CR for the new page was a chance event and in reality, the actual CR could be close to 10% (the same as the original page CR) → This means that we fail to reject the null hypothesis.
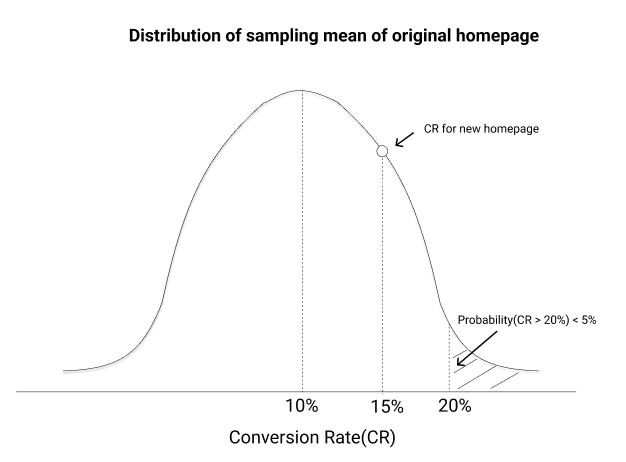
If the probability is less than the threshold, we can say that the CR for the new page is actually different from the original 10% →This means that we reject the null hypothesis.
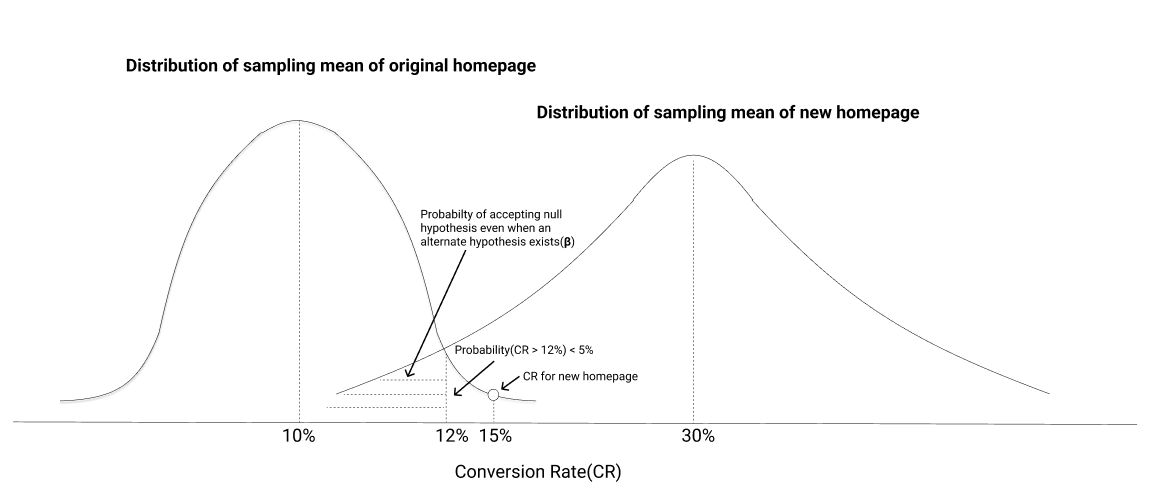
However, there is another problem when we blindly reject the null hypothesis. Suppose an alternate hypothesis exists(CR is not 10%). If we take many samples for the new page(our test group) users and measure the CR, the distribution of the CRs will look like the right curve below -

If the CR for our test group falls anywhere in the shaded region, we would fail to reject our null hypothesis even though an alternate hypothesis exists. We would want the shaded region to be as small as possible → which means that even if measure the new page CR for multiple samples of users, we will be rejecting the null hypothesis in most of the cases(80% is generally used).
When we conduct A/B tests, we generally want to reject the null hypothesis in favor of an alternative that improves our business outcomes. When we reject the null hypothesis, we need to ensure that -The probability of rejecting the null hypothesis given the null hypothesis is true is less than a threshold(<5%). This threshold is known as the significance level.
The probability of rejecting the null hypothesis when an alternate hypothesis exists is more than a threshold(>80%). This threshold is known as power.

We have decided the minimum effect that we want to measure, the significance level, and the power for our test. These parameters are used to calculate the number of users that need to go through our test version in order to make a conclusion.
To calculate the sample size needed, we can simply use this calculator -
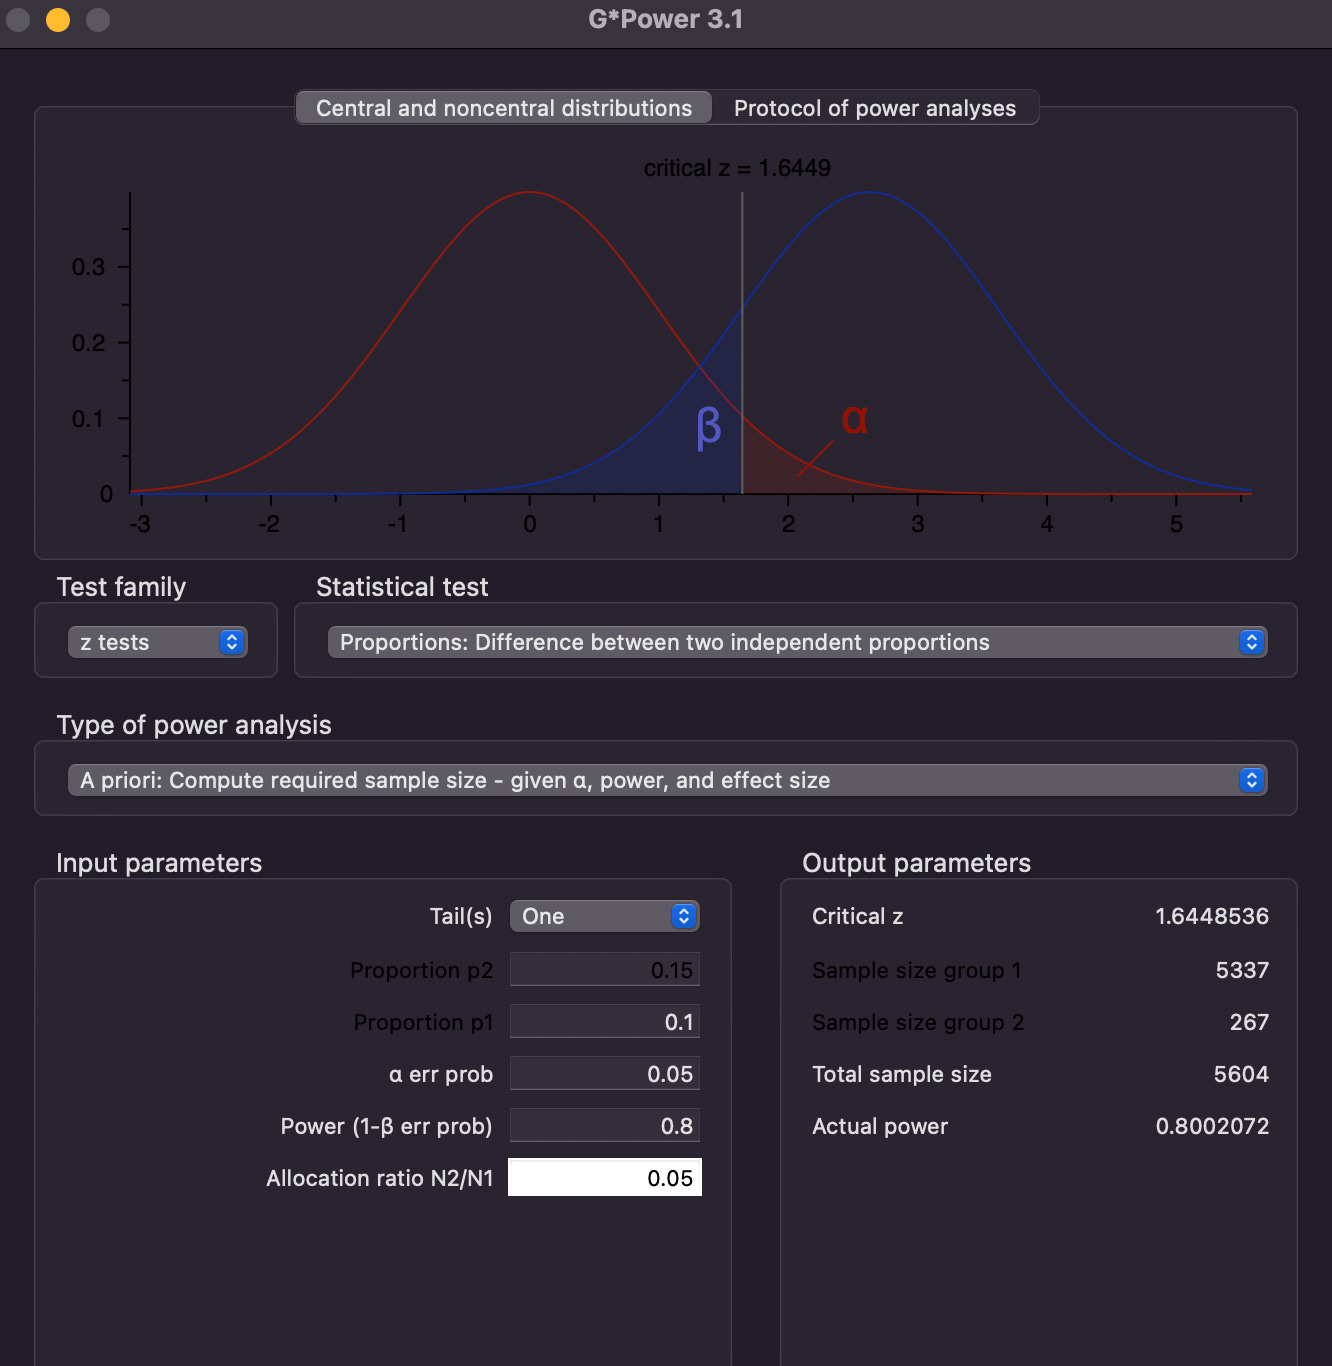
From the sample size we get from the calculator and the daily traffic, we can estimate the number of days it would take to conclude the test.
REFERENCES
https://www.khanacademy.org/math/statistics-probability/significance-tests-one-sample/idea-of-significance-tests/v/simple-hypothesis-testing
https://vinaysays.medium.com/a-b-testing-how-to-determine-the-sample-size-46e5419a2242